Code Profiling using Scalene and Optimizations using LLM #
Introduction #
Okay I will be honest, I could not come up with a shorter name. In this blog, we will learn how to profile our code(look at how much cpu and memory our code is consuming) and then use results of profiling to optimize our code using LLMs.
We will be using the following libraries to accomplish our task:
- Scalene - To profile our code.
- Groq - For LLM calls.
Motivation #
Python has been a popular choice for programming language due to its simpler learning curve and ease of syntax. Since a lot of the complex concepts are abstracted, it makes it easier for people to program complex systems with relative ease. However this abstraction can cause us to write non-optimized code without realizing. Few weeks back, I was working on one of my side projects and it involved running multiple computationally heavy experiments. Although I was able to code the logic quickly, the run took a long time to execute. Frustrated, I decided to profile my code and to my surprise found out a lot of code snippets which I thought were simpler statements were the biggest culprits. That prompted me to explore the topic of code optimizations.
What is Scalene? #
Scalene is a library that helps us profile our code(both as functions or line by line) and then log the cpu and memory usage. It can also log gpu memory usage but at the moment it is limited to nvidia based systems. It generates these statistics and stores them in a html file. The way it logs these metrics is by periodically checking cpu, gpu and memory usage and logging them(sampling based profiler).
Some of the features of the library that makes it extremely useful are
- It has low overhead(typically 10-20%).
- It can provide both function level and line level profiling.
- It can separate out the time spent in executing python code from the time spent in native code(libraries written in c/c++ and others).
- It can also separate out system time which can help us identify I/O bottleneck.
- It has integrations with Chatgpt for quick suggestions(we will be using groq instead of this for this blog but feel free to explore that option as well)
Code Walkthrough #
import numpy as np

def multiply_arrays(a,b):
    products = []
    for num1 in a:
        for num2 in b:
            products.append(num1*num2)

    return products

arr1 = np.arange(1,10000)
arr2 = np.arange(1,10000)

result = multiply_arrays(arr1, arr2)
We will be using the above code as an example to demonstrate the capabilities of scalene and also optimize this code using the results of scalene with the help of llms.
The code(main.py) does the following
-
Initialize two numpy arrays of length 9999.
-
Multiply the two arrays using nested for loops.
Below is the overall plan we will follow to meet the objective of this article
-
Run scalene on this code to generate the usage report(scalene returns a json along with a html with the same content).
-
Filter the json to extract relevant details.
-
Use this filtered json as input to llm to find areas of improvement and code suggestions for cpu and memory.
-
Use the information from step 3 and pass to another llm call to ensure we get a single optimized source code that does both cpu and memory optimization.
-
Rerun scalene to see if performance improvement is achieved or not.
Now one question can arise that step 3 and 4 can be done in a single step and though it is true, I preferred to keep the tasks specific for each llm call instead of making it do multiple tasks at once. Also it might happen that the code suggestions for cpu might have some conflicts with the code suggestions for memory. So the second call instructs the llm to handle such conflicts.
Step 1 #
scalene --html --outfile non_optimized.html main.py
The command is simple and easy to understand. We specify that we need a html file(it also creates a json) with the name non_optimized.html(it creates the json with the same name) and then we specify on which file we want to run.
If we open the html, it looks something like this.
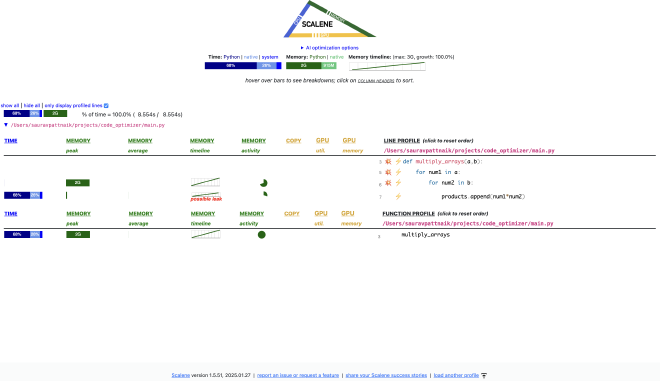
Let us analyze this report step by step
-
On the top just below the logo, we can see three metrics, the time taken to run, memory usage and the memory usage timeline.
-
The time taken to run is also split by three categories namely python, native code and system code.
-
The memory usage is also shown by two categories, memory usage by python code and native code.
-
Overall we can 68% of the time is spent in executing python code with a nearly 2GB memory consumption by python. The code takes 8.554 seconds to run.
-
Below we see the metrics line by line which can help us for a more granular understanding.
-
Finally at the end, we also see metrics for every function as a whole.
Step 2 #
This report is very good for visualizing the usage metrics but for our pipeline, we need the json format for the same.
The json format for the same metric looks something like:
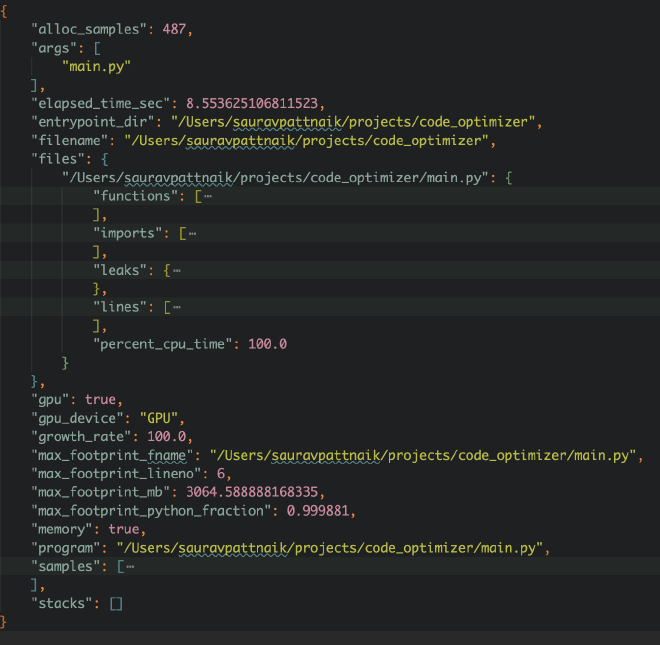
What we are most interested in is the “lines” key of this json that stores the usage metrics at line level of the code. Below is how the structure looks like for one line of code
{
                    "end_outermost_loop": 1,
                    "end_region_line": 1,
                    "line": "import numpy as np\n",
                    "lineno": 1,
                    "memory_samples": [],
                    "n_avg_mb": 0.0,
                    "n_copy_mb_s": 0.0,
                    "n_core_utilization": 0.0,
                    "n_cpu_percent_c": 0.0,
                    "n_cpu_percent_python": 0.0,
                    "n_gpu_avg_memory_mb": 0.0,
                    "n_gpu_peak_memory_mb": 0.0,
                    "n_gpu_percent": 0,
                    "n_growth_mb": 0.0,
                    "n_malloc_mb": 0.0,
                    "n_mallocs": 0,
                    "n_peak_mb": 0.0,
                    "n_python_fraction": 0,
                    "n_sys_percent": 0.0,
                    "n_usage_fraction": 0.0,
                    "start_outermost_loop": 1,
                    "start_region_line": 1
}
Now we are not interested for all the keys here and want to select specific parameters that are useful for our work. The code parses the json and extracts the relevant keys for every line of code.
import json

def parse_and_filter_json():
    path = 'non_optimized.json'
    profile_json = json.load(open(path,'r'))
    keys_to_take = ["line","n_avg_mb","n_copy_mb_s","n_core_utilization","n_cpu_percent_c","n_cpu_percent_python","n_malloc_mb","n_mallocs","n_peak_mb","n_python_fraction","n_sys_percent","n_usage_fraction"]

    filtered_response = {}
    all_possible_files = list(profile_json['files'].keys())

    for file_name in all_possible_files:
        filtered_response[file_name] = {}
        complete_code = ""
        line_level_details = []
        for line_response in profile_json["files"][file_name]["lines"]:
            complete_code += line_response['line']
            line_json = {k:v for k,v in line_response.items() if k in keys_to_take}
            line_level_details.append(line_json)

        filtered_response[file_name]['code'] = complete_code
        filtered_response[file_name]['line_level_details'] = line_level_details

    return filtered_response
The code is relatively straightforward to understand, so I won’t be spending much time on it.
Step 3 #
Now that we have the filtered json with us, we can prompt a llm to identify areas of optimization and then suggest code fixes for the same. For this blog, I will be using the llama-3.3-70b-versatile. The prompt for the same is given below
def get_optimization_prompt(response_json):
    metrics_definition = json.load(open("metrics_definitions.json","r"))
    prompt = f"""
    You are a helpful AI assistant whose task is to optimize a given python source code in terms of cpu and memory usage.
    To help you with the task, you will be given two inputs, CODE and LINE_LEVEL_METRICS. CODE essentially contains
    the entire source code which we want to optimize. LINE_LEVEL_METRICS is a python list of dictionaries, each of which
    corresponds to each individual line in the CODE. Each of these dictionary comprises of multiple fields which stores information
    related to the code being executed, the cpu and memory usage. To better understand these fields, please refer the ADDITIONAL INFORMATION that is provided below.

    ADDITIONAL INFORMATION : {metrics_definition}

    Your have to analyze CODE, LINE_LEVEL_METRICS and identify areas of improvement both in terms of cpu and memory usage. You can leverage
    ADDITIONAL INFORMATION to understand what each key means and use that to identify areas of improvement for both cpu and memory utilization.
    After finding the areas of improvement, your task is to also recommend optimized codes for the same.

    Please return the response in below python dictionary format
    ```
    {{
        "cpu_optimization" : {{
            "areas_of_improvement" : a python list containing recommendations to minimize cpu usage,
            "optimized_codes" : a list containing optimized python codes for each of the recommendations

        }},
        "memory_optimization" : {{
            "areas_of_improvement" : a python list containing recommendations to minimize memory usage,
            "optimized_codes" : a list containing optimized python codes for each of the recommendations

        }}

    }}

    ```
    Do not output any additional text apart from the response format that is described above.

    CODE : {response_json['code']}
    LINE_LEVEL_METRICS : {response_json['line_level_details']}
    OUTPUT :
    """
    return prompt
One additional thing to mention here is the variable metrics_definition. This is nothing but a one line definition of each of the parameters that we extracted/filtered in the previous step from the json.
Here is how the file looks like
{
    "line": "The actual line of code being analyzed.",
    "n_avg_mb": "The average memory usage (in MB) for this line.",
    "n_copy_mb_s": "The amount of memory copied per second (in MB/s).",
    "n_core_utilization": "The fraction of available CPU cores used by this line.",
    "n_cpu_percent_c": "The percentage of CPU time spent in C/native code for this line.",
    "n_cpu_percent_python": "The percentage of CPU time spent in Python code for this line.",
    "n_malloc_mb": "The total memory allocated (in MB) by this line.",
    "n_mallocs": "The number of memory allocation (malloc) calls made by this line.",
    "n_peak_mb": "The peak memory usage (in MB) for this line.",
    "n_python_fraction": "The fraction of execution time spent in Python vs. native code.",
    "n_sys_percent": "The percentage of system-level CPU usage for this line.",
    "n_usage_fraction": "The fraction of total resource usage (CPU/memory) attributed to this line."
}
Also the code to call groq api is also simple and can be referenced from their documentation
import os
from dotenv import load_dotenv
from groq import Groq

load_dotenv()


def run_groq_api(prompt, model='llama-3.3-70b-versatile'):

    client = Groq(
        api_key=os.environ.get("GROQ_API"),
    )

    chat_completion = client.chat.completions.create(
        messages=[
            {
                "role": "user",
                "content": prompt,
            }
        ],
        model=model,
    )

    response = chat_completion.choices[0].message.content
    return response
Once we run this prompt, we get the following response from the model(post some cleaning)
{
    "cpu_optimization": {
        "areas_of_improvement": [
            "Optimize nested for loops in the multiply_arrays function by using NumPy's vectorized operations.",
            "Avoid using Python's built-in append method in loops; instead, use list comprehension or NumPy's array operations."
        ],
        "optimized_codes": [
            "import numpy as np\ndef multiply_arrays(a, b): return np.multiply(a[:, None], b)",
            "import numpy as np\ndef multiply_arrays(a, b): return (a[:, None] * b).flatten()"
        ]
    },
    "memory_optimization": {
        "areas_of_improvement": [
            "Avoid creating large intermediate arrays in the multiply_arrays function.",
            "Use NumPy's array operations instead of Python's lists to reduce memory usage."
        ],
        "optimized_codes": [
            "import numpy as np\ndef multiply_arrays(a, b): return np.multiply(a[:, None], b)",
            "import numpy as np\ndef multiply_arrays(a, b): products = np.empty((len(a), len(b))); "
            "for i in range(len(a)): for j in range(len(b)): products[i, j] = a[i] * b[j]; return products.flatten()"
        ]
    }
}
Step 4 #
The next step was to pass the above response to another llm call that returns the entire source code applying both cpu and memory optimizations. The prompt for the task is given below
def get_code_prompt(optimization_response):
    prompt = f"""
    You are a helpful AI assistant whose task is write optimized code given code optimization recommendations. As input you will
    be given OPTIMIZATION_DICT that will contain recommendations along with some optimized codes for both
    cpu and memory usage. You have to follow the recommendations given and return optimized code that does both cpu and memory optimizations.
    Note that the suggestions for cpu and memory optimizations might have conflicts between them and might not be compatible. Your task is to resolve those conflicts and
    provide code that does both cpu and memory usage optimization.

    The OPTIMIZATION_DICT will have the following structure:
    ```
    {{
        "cpu_optimization" : {{
            "areas_of_improvement" : a python list containing recommendations to minimize cpu usage,
            "optimized_codes" : a list containing optimized python codes for each of the recommendations

        }},
        "memory_optimization" : {{
            "areas_of_improvement" : a python list containing recommendations to minimize memory usage,
            "optimized_codes" : a list containing optimized python codes for each of the recommendations

        }}

    }}
    ```

    Please provide the output in the below format
    ```
    {{

        "optimized_code" : the final optimized code which can be run directly.
    }}
    ```
    Please do not output any additional text apart from response format that is described above.
    OPTIMIZATION_DICT : {optimization_response}
    OUTPUT :
    """

    return prompt
Running this yielded the below result
import numpy as np

def multiply_arrays(a, b):
    products = np.multiply(a[:, None], b)
    return products.flatten()
Before we run scalene on this updated codebase, we must first do a sanity check on our side to see if both the codes return the same result or not.
import numpy as np

def multiply_arrays_unoptimized(a,b):
    products = []
    for num1 in a:
        for num2 in b:
            products.append(num1*num2)

    return products

def multiply_arrays_optimized(a, b):
    products = np.multiply(a[:, None], b)
    return products.flatten()

arr1 = np.arange(1,10000)
arr2 = np.arange(1,10000)


result_unoptimized = multiply_arrays_unoptimized(arr1, arr2)
result_optimized = multiply_arrays_optimized(arr1,arr2)
print(all(result_optimized == result_unoptimized))
This resulted in output True being printed on the screen.
Step 5 #
Now that we have successfully tested the new code on our side, let us run scalene again with the updated code in place of the older code.
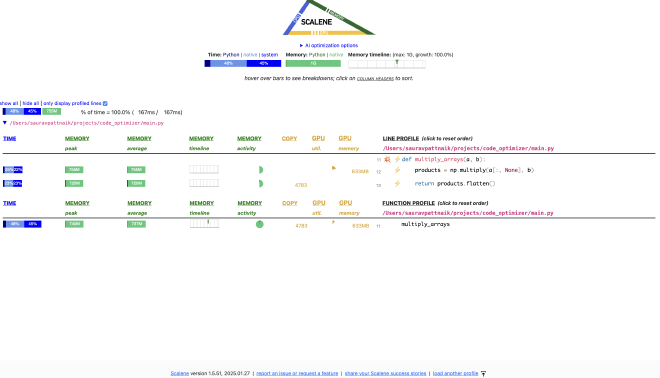
-
Code runs extremely fast, 167ms only.
-
Time taken to run python code and memory consumption by python code has reduced drastically(in fact all memory consumption is now by native code.)
-
At the same time, the above usage have increased for native code as we are relying on numpy more for our task.
-
Even though, the cpu and memory consumption has increased for native code, we have to understand that they are much faster and optimized code. So overall our code performance increases.
Final Thoughts #
I think it’s a good practice to profile your code to look for bottlenecks in performance. That can help us write clean fast and elegant code. Using LLMs then to fix our code can be a good extension provided we are doing a manual review of the changes instead of putting things in autopilot mode.
Thank you for taking the time to read the article.
Cheers!